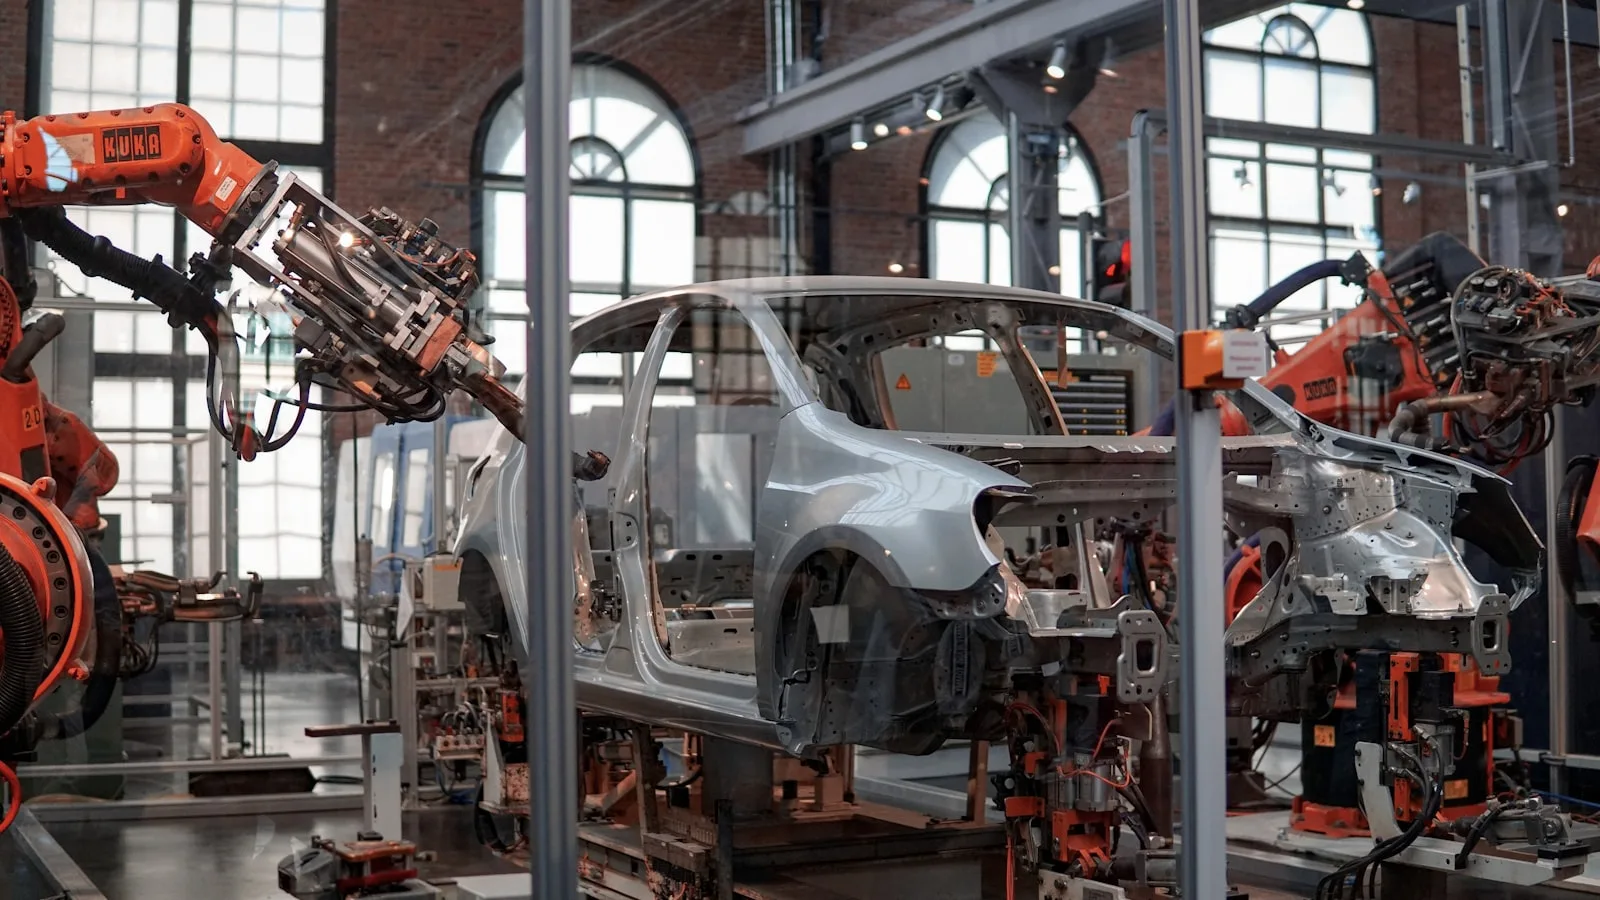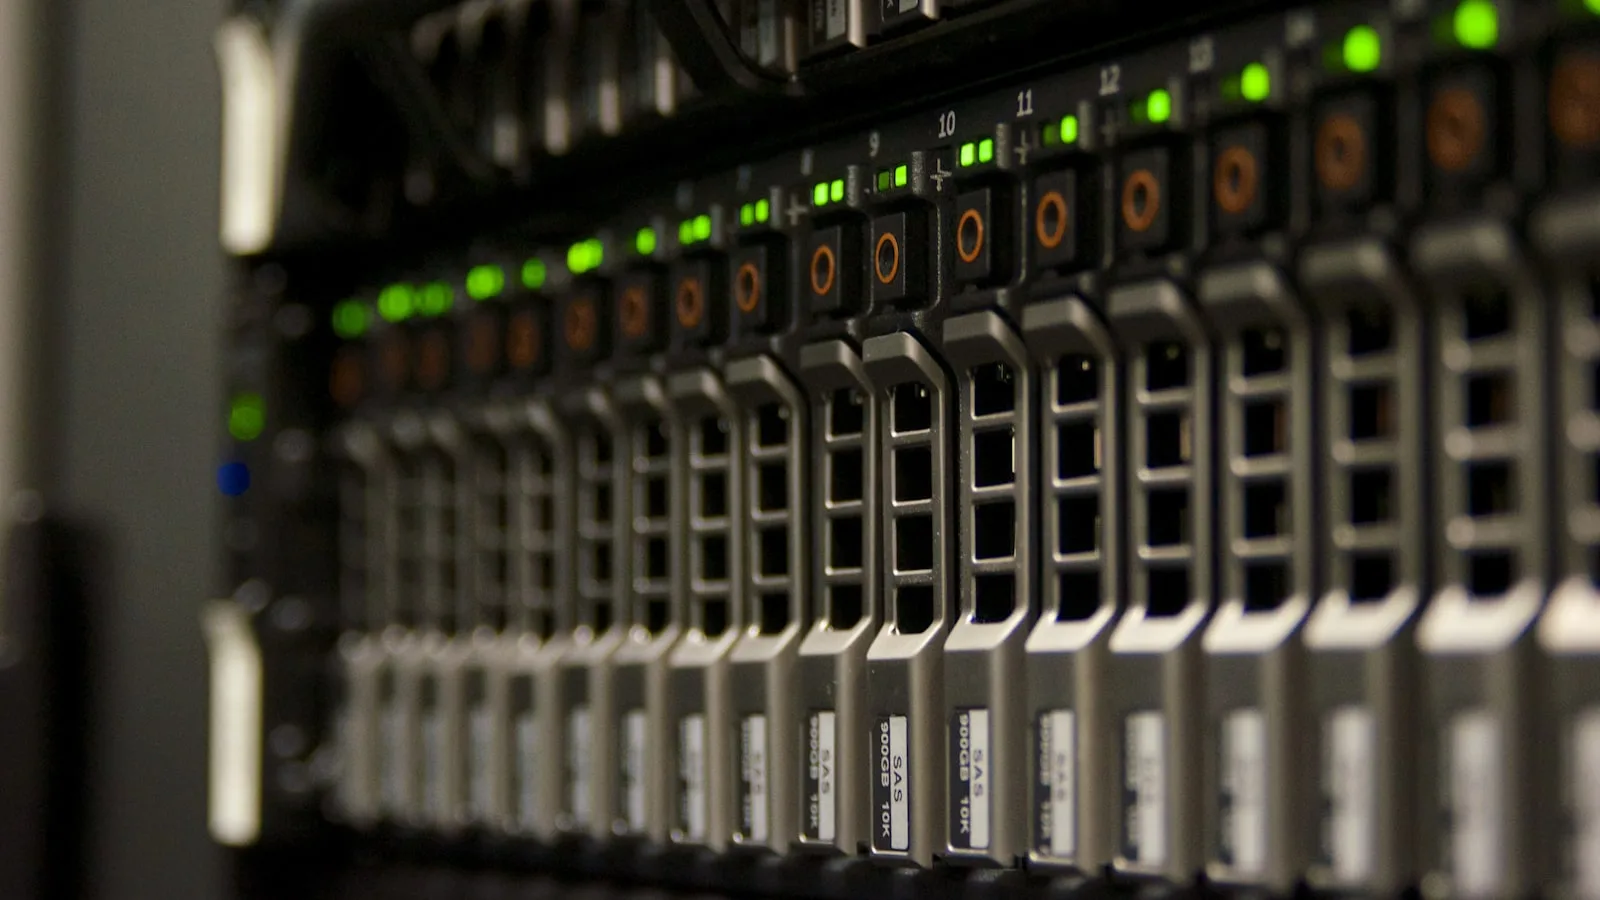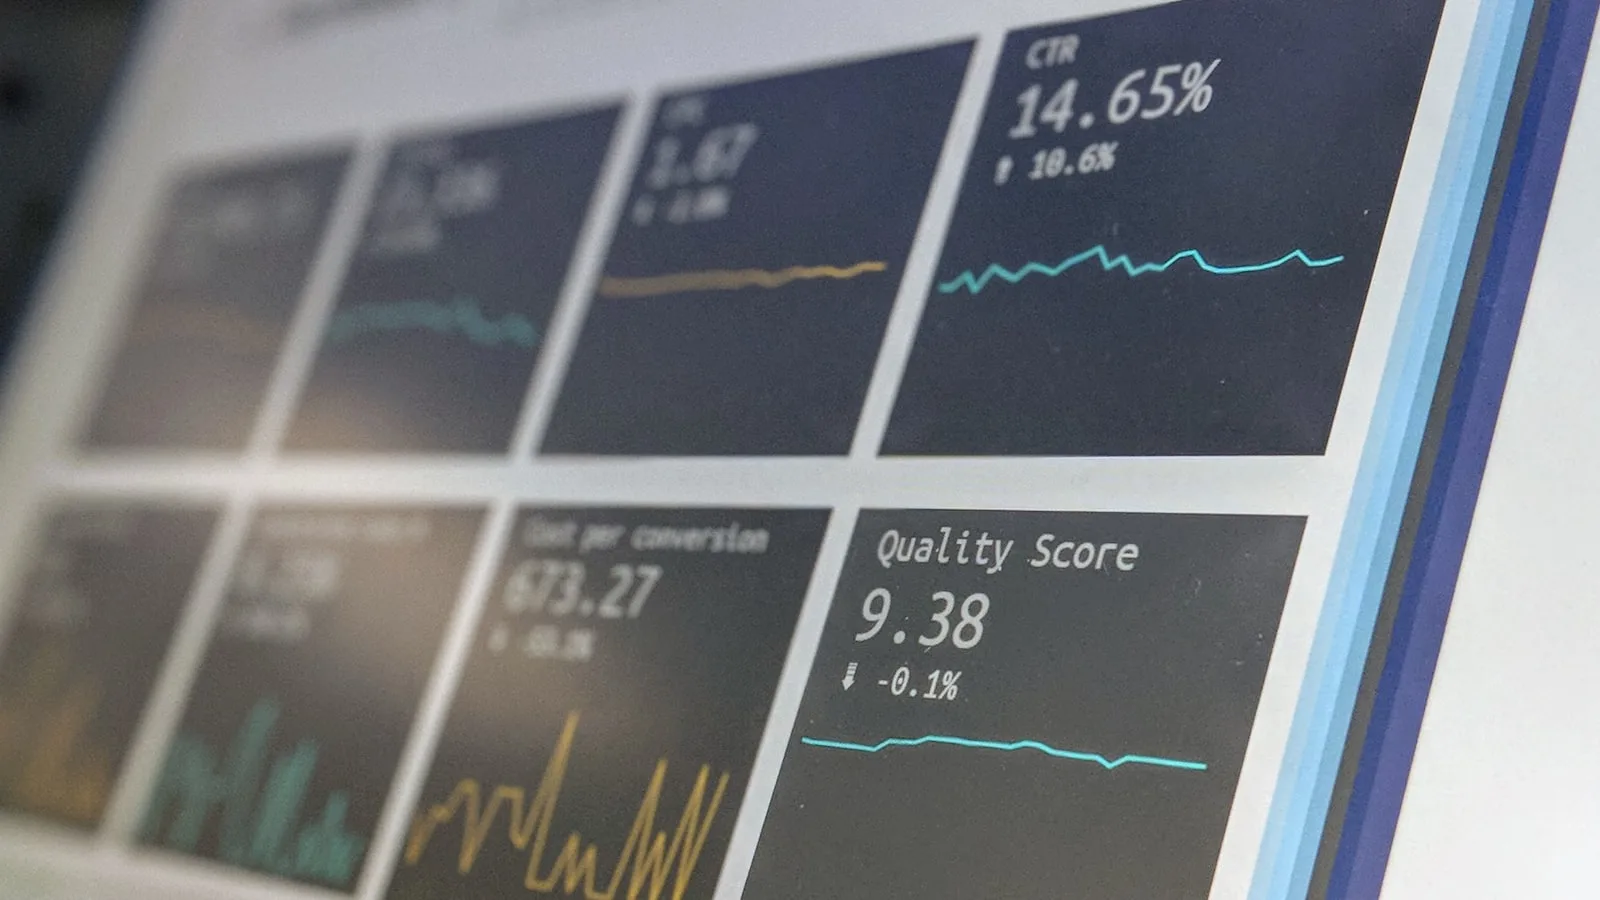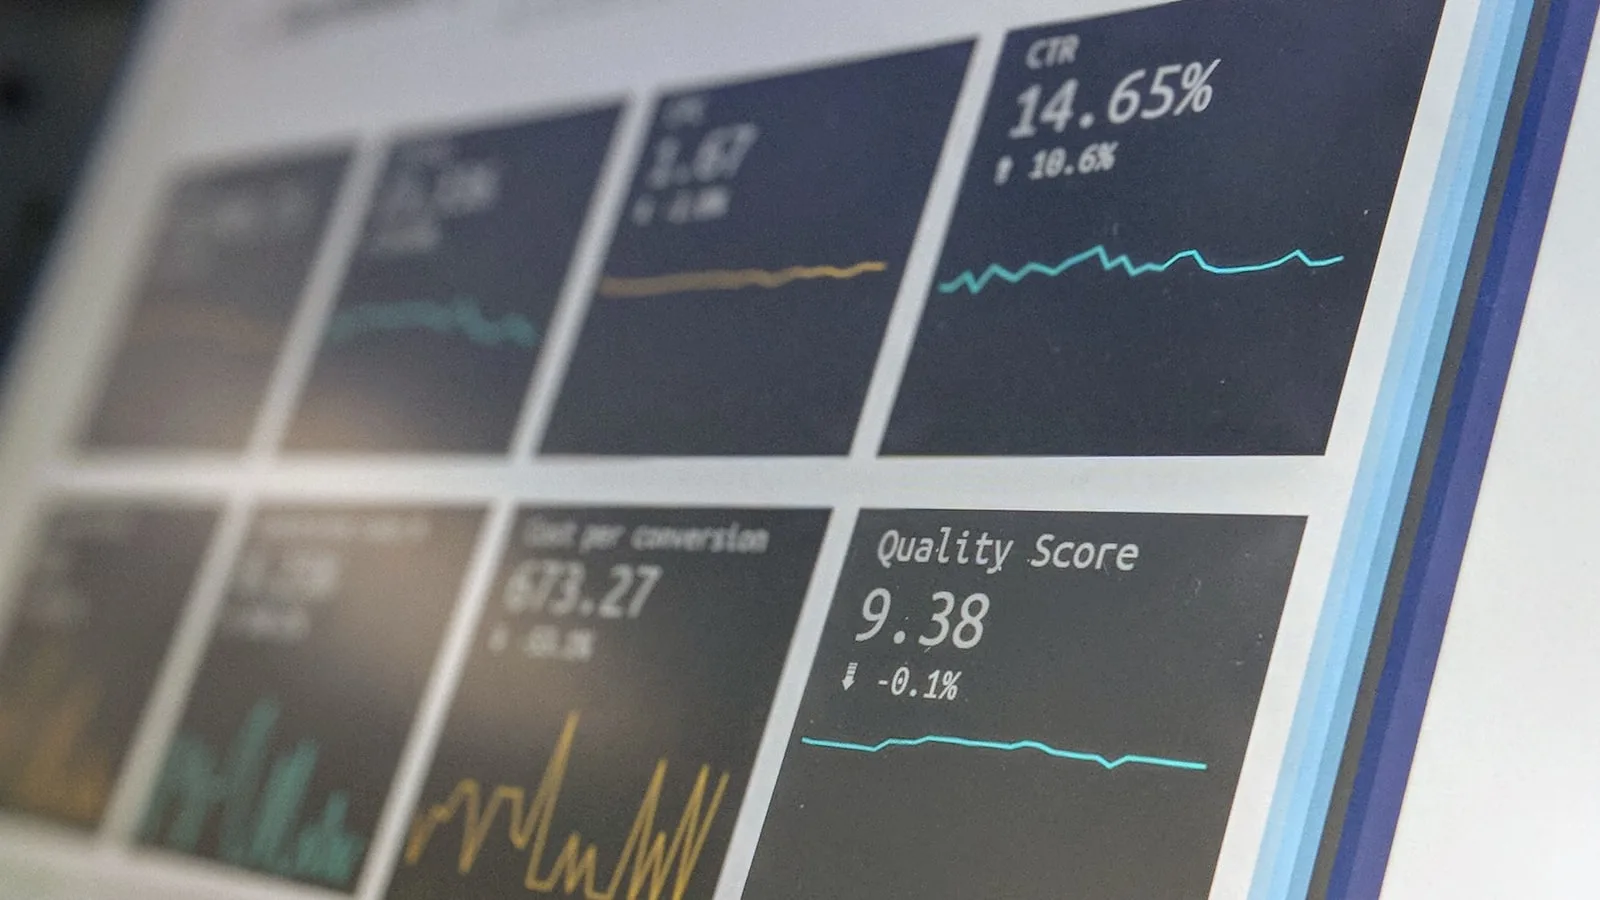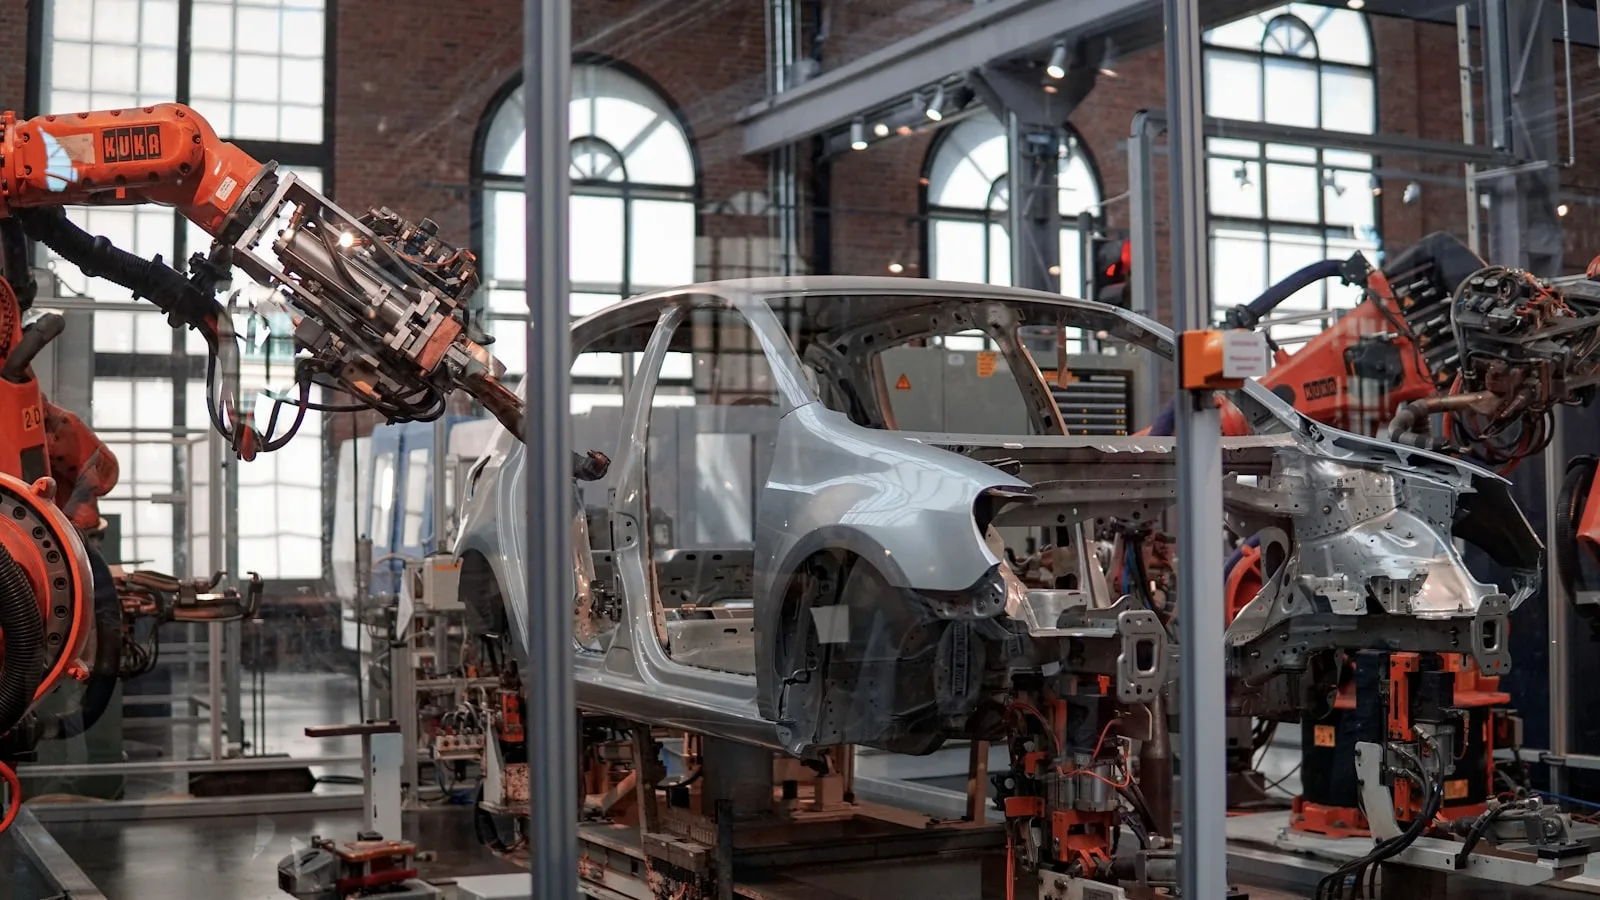
Smart manufacturing starts with a simple promise: real-time visibility into what’s happening on the factory floor. The challenge is turning raw machine signals into KPIs that operators and leaders can trust.
Not every metric needs milliseconds. For most operations, “real-time” means updates every few seconds to a minute, with strong reliability guarantees. The key is designing pipelines that don’t silently drop events or drift over time.
Start with the KPIs that directly change behavior:
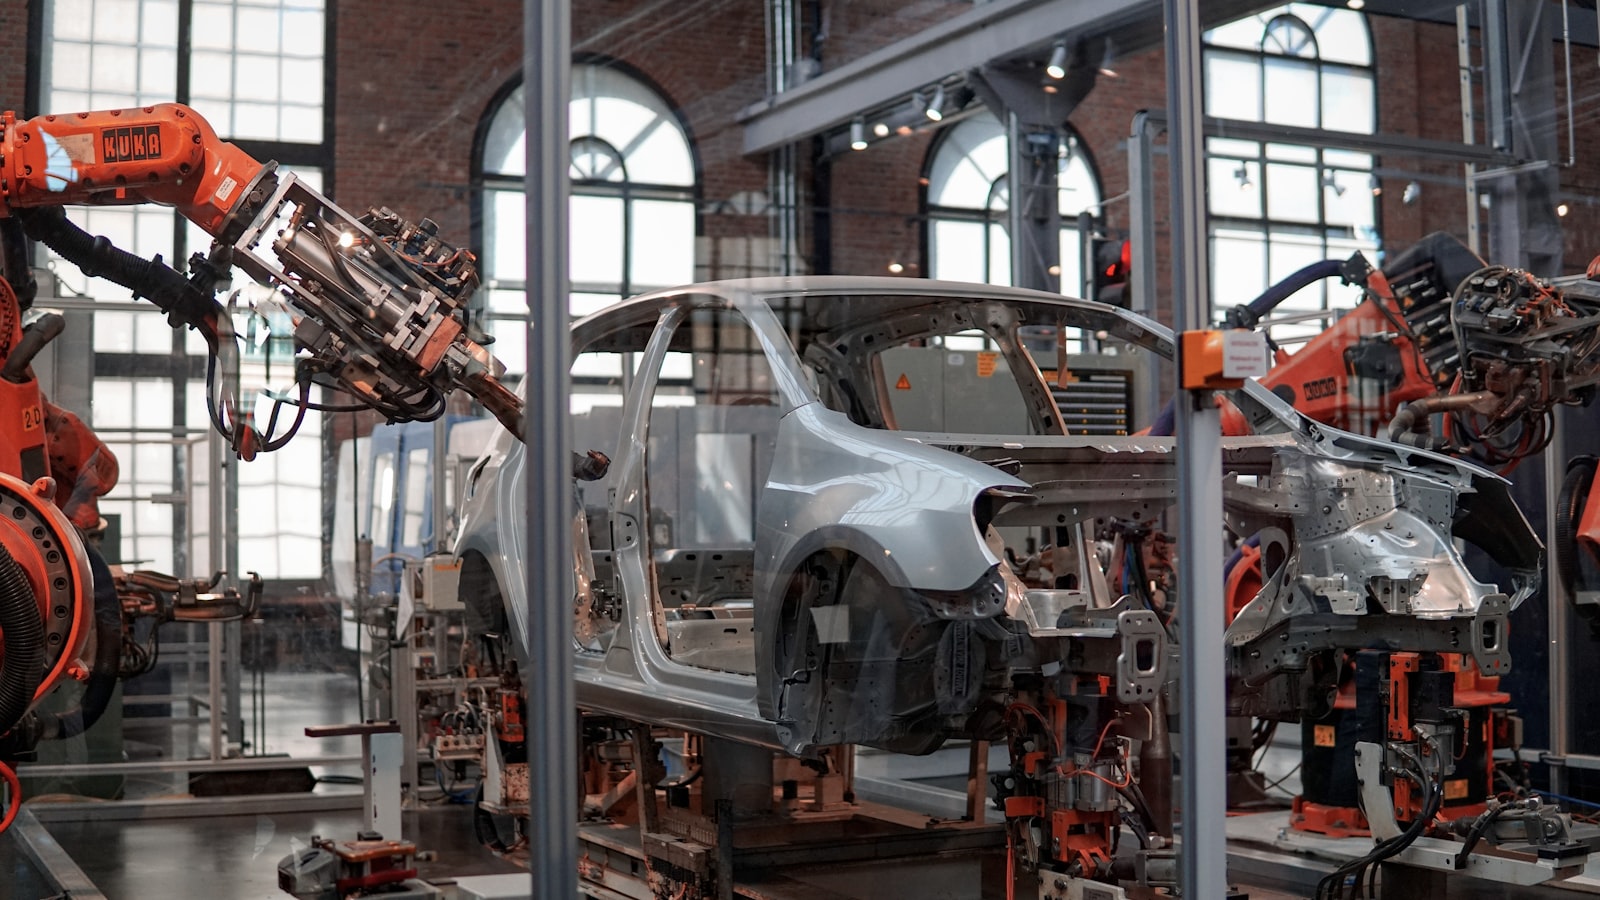
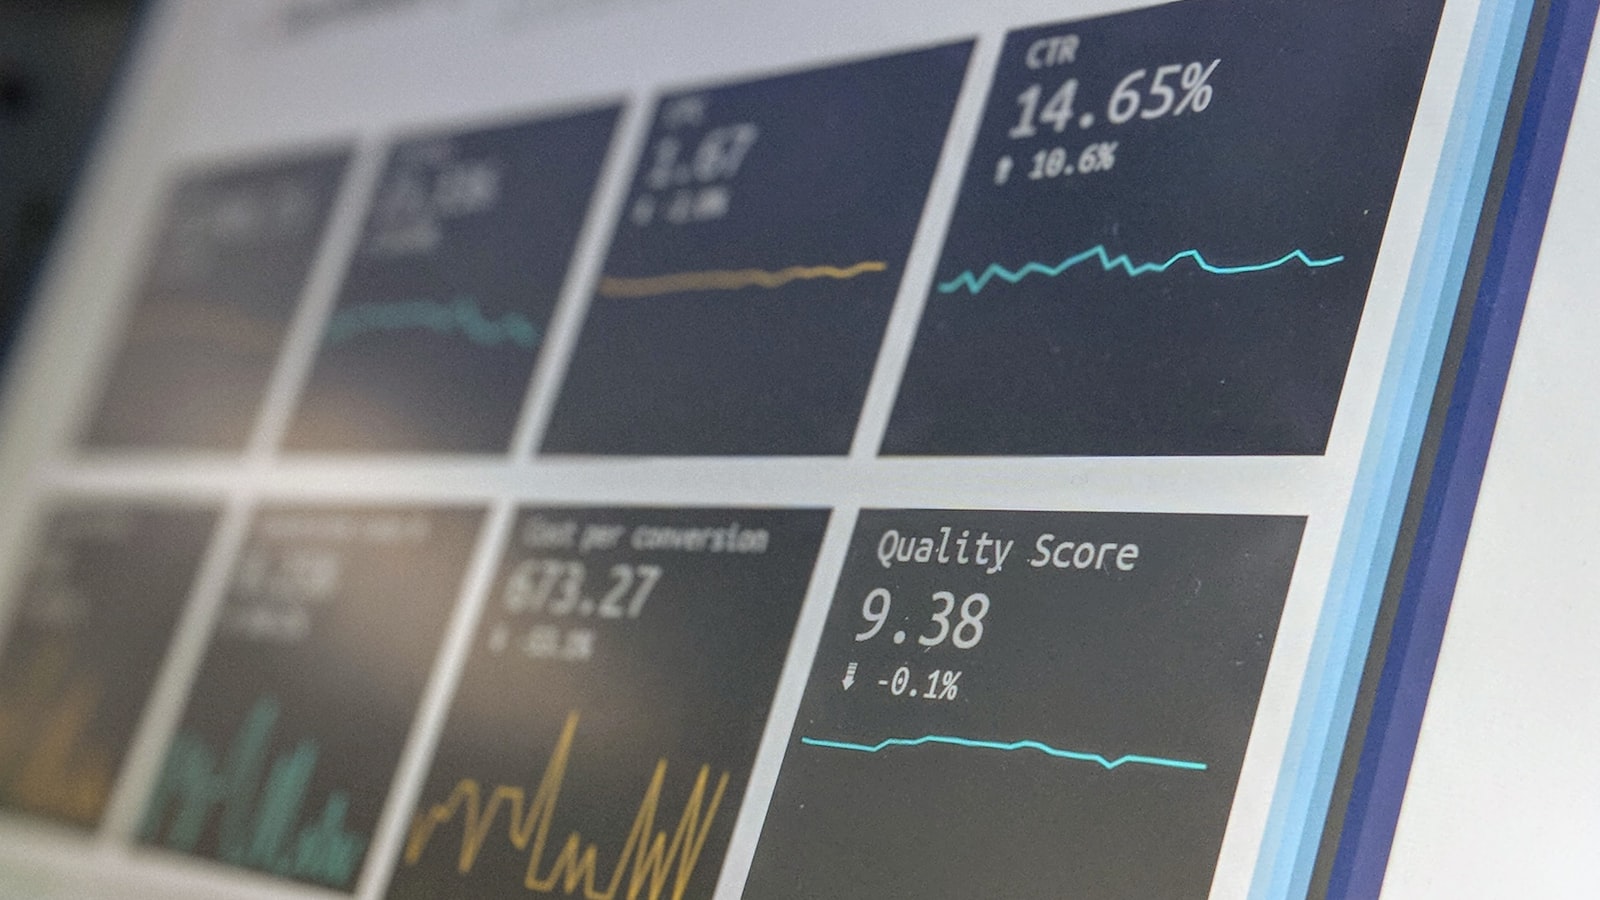
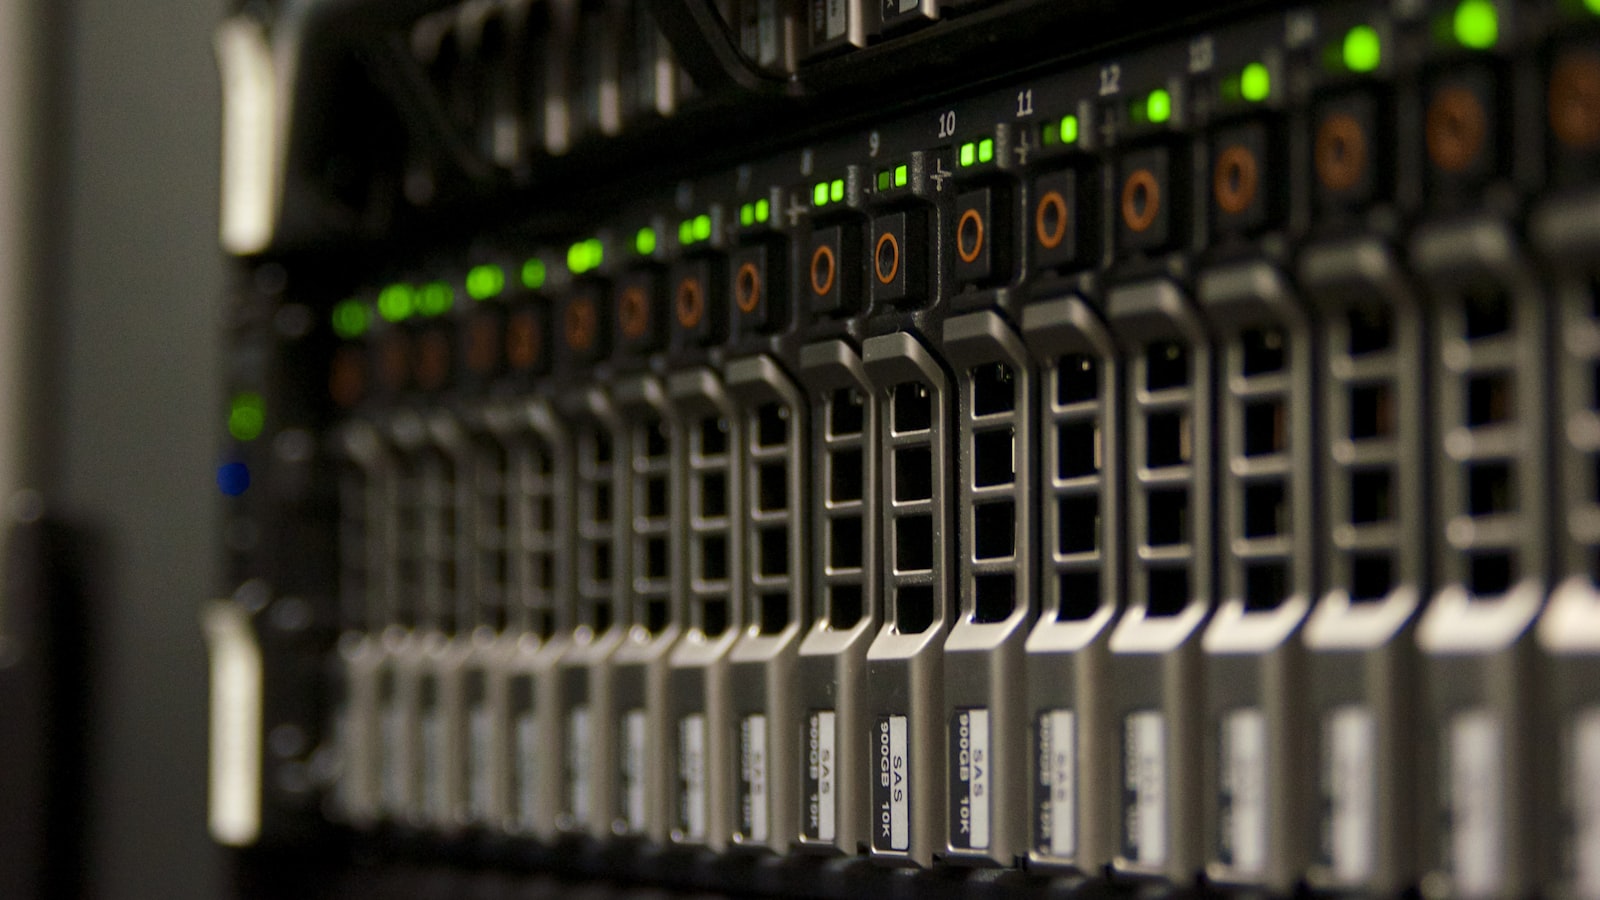
When KPIs are defined and tested, teams stop arguing about data and start improving the process.
Lumicore Manufacturing SystemsLumicore can help integrate plant data sources, define KPI standards, and deploy dashboards and alerts that drive measurable improvements on the shop floor.

Lumicore Sinergi Awan is a technology company specializing in AI solutions, cloud infrastructure, and smart manufacturing systems that drive digital transformation and operational excellence.
Lumicore Sinergi Awan helps organizations implement AI, cloud infrastructure, data analytics, and smart manufacturing solutions. We focus on business outcomes such as higher uptime, faster decision cycles, and stronger operational efficiency.